
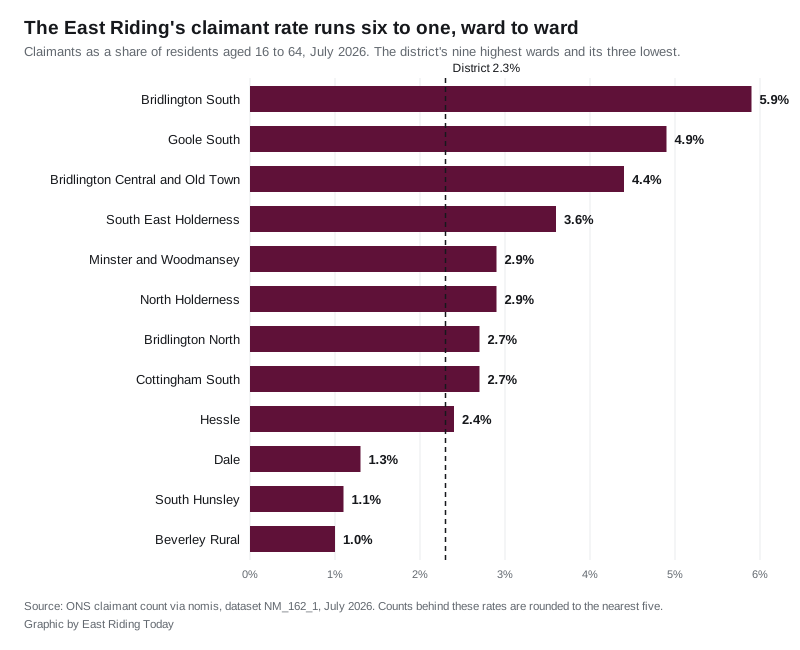
Bridlington South stands at 5.9% and Beverley Rural at 1.0%, a six-to-one gap inside one district. Beverley's wards rose most since January.
There were 4,705 people claiming unemployment-related benefits in the East Riding of Yorkshire in July, 2.3% of everyone aged 16 to 64. That is 185 more than a year earlier, a rise of 4.1%.
The UK rose 1.3% over the same year. The district’s increase is roughly three times the national one, off a much lower base.
That single district figure hides almost everything that matters. The East Riding runs from Hull’s edge at Cottingham to the North Sea at Withernsea, and the gap between its wards is close to six to one.
Where the rate is highest, and lowest
Bridlington South is the district’s highest ward at 5.9%, with 500 claimants. Beverley Rural is the lowest at 1.0%, with 90. Against all 6,807 English wards, Bridlington South ranks 770th highest and Beverley Rural 6,642nd, so both ends of this district sit near the ends of the national range.
The pattern is not town against countryside. It is a split inside the towns themselves:
- Bridlington South 5.9%, Bridlington North 2.7%. The rate more than doubles across one seaside town.
- Goole South 4.9%, Goole North 2.4%. The same, almost exactly, across the port.
- Hessle 2.4%, South Hunsley 1.1%. Two neighbouring stretches of the Humber bank. South Hunsley covers Swanland and the villages west of Hessle.
- Minster and Woodmansey 2.9%, St Mary’s 1.7%. Beverley’s own two urban wards.
Beverley Rural, the lowest in the district, covers Walkington, Bishop Burton, Leconfield and Leven, according to postcodes.io ward lookups. South East Holderness, fourth highest at 3.6%, covers Withernsea.
Every ward, ranked
Counts are rounded to the nearest five, which is why the wards add to 4,715 rather than the district’s 4,705. The final column is the change since January 2026, the first month for which ward figures exist in this series.
| Ward | Claimants | Rate | Change since January |
|---|---|---|---|
| Bridlington South | 500 | 5.9% | -105 |
| Goole South | 360 | 4.9% | +10 |
| Bridlington Central and Old Town | 265 | 4.4% | -5 |
| South East Holderness | 285 | 3.6% | -60 |
| Minster and Woodmansey | 320 | 2.9% | +55 |
| North Holderness | 160 | 2.9% | +10 |
| Bridlington North | 160 | 2.7% | +5 |
| Cottingham South | 155 | 2.7% | 0 |
| Goole North | 165 | 2.4% | -5 |
| Hessle | 245 | 2.4% | +35 |
| Cottingham North | 110 | 2.2% | +10 |
| Howden | 85 | 2.2% | +15 |
| South West Holderness | 165 | 2.1% | -15 |
| Tranby | 130 | 2.1% | -10 |
| Driffield and Rural | 185 | 2.0% | -5 |
| East Wolds and Coastal | 140 | 1.7% | -10 |
| St Mary’s | 160 | 1.7% | +10 |
| Mid Holderness | 125 | 1.6% | +5 |
| Snaith, Airmyn, Rawcliffe and Marshland | 100 | 1.6% | +10 |
| Willerby and Kirk Ella | 125 | 1.6% | 0 |
| Pocklington Provincial | 180 | 1.5% | 0 |
| Wolds Weighton | 155 | 1.5% | +25 |
| Howdenshire | 140 | 1.4% | -15 |
| Dale | 140 | 1.3% | +20 |
| South Hunsley | 70 | 1.1% | 0 |
| Beverley Rural | 90 | 1.0% | -15 |
The direction of travel has flipped
Read that last column and the expected story turns over. Since January the claimant count has fallen fastest in the district’s hardest-pressed places and risen fastest in its most comfortable one.
- Bridlington South is down 105, the largest fall of any ward, from 605 in January.
- South East Holderness, covering Withernsea, is down 60.
- Minster and Woodmansey is up 55, the largest rise of any ward. It is a Beverley ward.
- Hessle is up 35, and Wolds Weighton, covering Market Weighton, is up 25.
Bridlington South remains far and away the highest ward, and one improving half-year does not undo that. But the places adding claimants this year are Beverley, Hessle and the market towns, not the coast.
Across the district as a whole the six months have been broadly flat. The count peaked at 4,940 in March, fell to 4,605 in June, then rose again to 4,705 in July.
Two thirds of the annual rise is under-25s
The 185 extra claimants since July 2025 are not spread across the age range. Nearly all of the increase sits in one band.
- Aged 18 to 24: 980, up 120 on the year, a rise of 14%.
- Aged 40 to 44: 535, up 50.
- Aged 65 and over: 125, up 35.
- Aged 35 to 39: 505, down 35, the largest fall of any band.
So 120 of the 185 additional claimants, about two thirds, are aged 18 to 24. That group now makes up one claimant in five in the district. The UK’s under-25 claimant count rose 9.7% over the same year, and Yorkshire and the Humber’s rose 8.5%, so the East Riding’s 14% is well ahead of both. Among the region’s 15 councils, only Barnsley and York rose faster, and Wakefield’s rise was all but identical to ours.
How the district compares
The East Riding remains a low-claimant area by regional standards.
- East Riding of Yorkshire: 2.3%
- Yorkshire and the Humber: 4.1%
- United Kingdom: 3.9%
- Kingston upon Hull: 5.1%
Hull is the sharper comparison, because the district wraps around it. Over the year Hull’s count fell by 595 to 9,095, a drop of 6.1% and the steepest fall of any council in Yorkshire and the Humber. The East Riding rose. The city and the county it sits inside moved in opposite directions.
What it means for you
The claimant count is not the unemployment rate. It counts people claiming Universal Credit who are required to look for work, plus the remaining Jobseeker’s Allowance claimants. Someone working part time on a low wage can be in it; someone out of work but not claiming is not. It is published monthly, five weeks after the count date, which makes it the fastest local labour market indicator there is.
Three things to take from this month’s figures:
- If you live in Bridlington or Withernsea, the local picture has genuinely improved since the winter, even though the rates there remain the highest in the district.
- If you are 18 to 24 and looking for work, the competition has grown. The number of claimants your age is up 14% in a year, and up from 860 to 980 in absolute terms.
- The wards at the two ends of this table are also the two ends of the district’s housing market. Our East Riding house prices page gives the typical sale price in each of the nine towns.
Sources: ONS claimant count via nomis, dataset NM_162_1, July 2026 release, for the East Riding of Yorkshire, its 26 wards, Yorkshire and the Humber, the United Kingdom and comparator councils. Ward geography checked against postcodes.io.
Correction, 20 September 2026. This article was published on 23 August 2026 using the July 2026 claimant count as the Office for National Statistics first released it. ONS has since revised July, as it routinely revises the most recent month, and the revisions change several figures above:
- The July count for the East Riding is now 4,595, not 4,705.
- The rise on July 2025 is therefore 75, or 1.7%, not 185 or 4.1%. The line describing the district’s increase as roughly three times the national one no longer holds.
- Claimants aged 18 to 24 in July are now 945, not 980, a rise of 85 on the year rather than 120. Because the total rise was revised down further than the young one, under-25s now account for more than the whole of the district’s annual increase, not two thirds of it.
- The sentence saying the count “rose again to 4,705 in July” is wrong on the revised series. July fell, from 4,605 in June to 4,595.
The ward table and the January comparison are left as published. The figures for August 2026 are in our August claimant count story, which uses the revised series throughout.
Have your say